QA Metrics That Actually Matter: A Practical Guide
Dominik SzahidewiczFebruary 19, 2026
This guide breaks down the most important QA metrics—such as test coverage, test case effectiveness, completion status, and productivity—to help you evaluate software quality and the efficiency of your testing process. By examining both process-oriented and product-focused metrics, QA teams can answer critical questions: How many test cases have been executed? What does our defect distribution reveal? Are our results reliable? And how effective are our tests overall?
Check also:
From measuring test execution progress and actual test hours to evaluating defect removal efficiency and customer satisfaction, software testing metrics provide leading and lagging indicators that drive continuous improvement. When QA teams can quantify test review efficiency, defects identified, and test execution status, they’re equipped to improve both the QA process and the overall software quality.
No more guesswork. With the right QA metrics, you’ll know whether your determined test hours match the test cases allocated, how reliable your tests are, and what metric measures matter most to your organization. Let’s dive into how to use these insights to build a better, faster, and smarter testing process.
Automate your tests for free
Test easier than ever with BugBug test recorder. Faster than coding. Free forever.
Get started
QA metrics are measurable indicators used to assess the quality, efficiency, and effectiveness of your software development and QA processes. They help quantify performance throughout the software development lifecycle and serve as the backbone of a robust QA strategy.
By tracking QA metrics, testing teams gain insights into:
QA metrics come in different forms, depending on what you’re trying to measure. They can be classified into:
Additionally, aligning these metrics with your testing strategy can help you identify areas of success and failure in your testing processes.
Additionally, you’ll encounter absolute metrics (e.g., total number of defects) and qualitative or derived metrics (e.g., test effectiveness percentage). Both are essential QA metrics that help you measure how efficient and effective your testing efforts really are.
Without metrics, teams are flying blind. You can’t improve what you don’t measure. QA metrics help answer crucial questions like:
They also provide actionable insights into areas that need improvement and guide strategic decisions about team structure, tooling, and process optimization. QA metrics also provide actionable insights into areas that need improvement in your testing procedures and guide strategic decisions about team structure, tooling, and process optimization.
Automate your tests for free
Test easier than ever with BugBug test recorder. Faster than coding. Free forever.
Get started
Implementing the right QA metrics isn’t just about tracking numbers; it’s about driving value throughout the software development process. Here’s how QA metrics impact the development process:
These are raw values collected throughout the testing process. Examples include:
These are calculated using absolute metrics to provide deeper insights. Examples include:
Here are the most critical QA metrics and what they reveal:
Tracks the effort invested during the testing phase by comparing estimated vs. actual test hours.
Measures how well tests identify defects before release. A high test effectiveness percentage is crucial for minimizing escaped bugs.
Test coverage measures how much of the application has been tested. This includes requirement coverage, code coverage, and functional coverage.
Analyzes the number of test cases executed per tester hour to gauge efficiency.
Evaluates how consistently test cases deliver the same results under the same conditions.
Shows where defects are most frequently found—across modules, components, or functionalities.
Provides a clear count of defects identified during a specific test phase.
Indicates the percentage of planned test cases that have been executed.
Represents the current state of all test cases—passed, failed, blocked, or skipped.
Defect Removal Efficiency helps assess how effectively defect fixes are being caught and fixed before release.
Compares the number of test cases reviewed vs. total test cases to ensure quality test design.
Monitors the status of test cases in real time, helping to avoid delays and improve responsiveness.
Examines the relationship between the number of test cases executed and the number of defects found.
Includes app speed, uptime, response time, and throughput—key indicators of end-user experience.
Often measured using CSAT scores, this metric helps correlate QA activities with user happiness
Automate your tests for free
Test easier than ever with BugBug test recorder. Faster than coding. Free forever.
Get started
Manual software tests often rely on human efficiency metrics like:
Automated testing adds metrics such as:
Use a hybrid approach to track both sets and analyze the impact.
In Agile and DevOps environments, speed and feedback loops matter most. This shifts the focus toward:
Tracking these QA metrics supports iterative development and continuous improvement.
When choosing metrics, keep the following principles in mind to ensure they align with your quality assurance processes:
Relevance to Objectives
Align metrics with specific project or product goals.
Simplicity and Clarity
Everyone on the team should understand what the metric measures.
Actionability
Metrics should drive decisions, not just fill reports.
Balance
Combine leading and lagging indicators for a holistic view.
Context Awareness
Don’t rely on a single metric; always interpret results in context.
Automate your tests for free
Test easier than ever with BugBug test recorder. Faster than coding. Free forever.
Get started
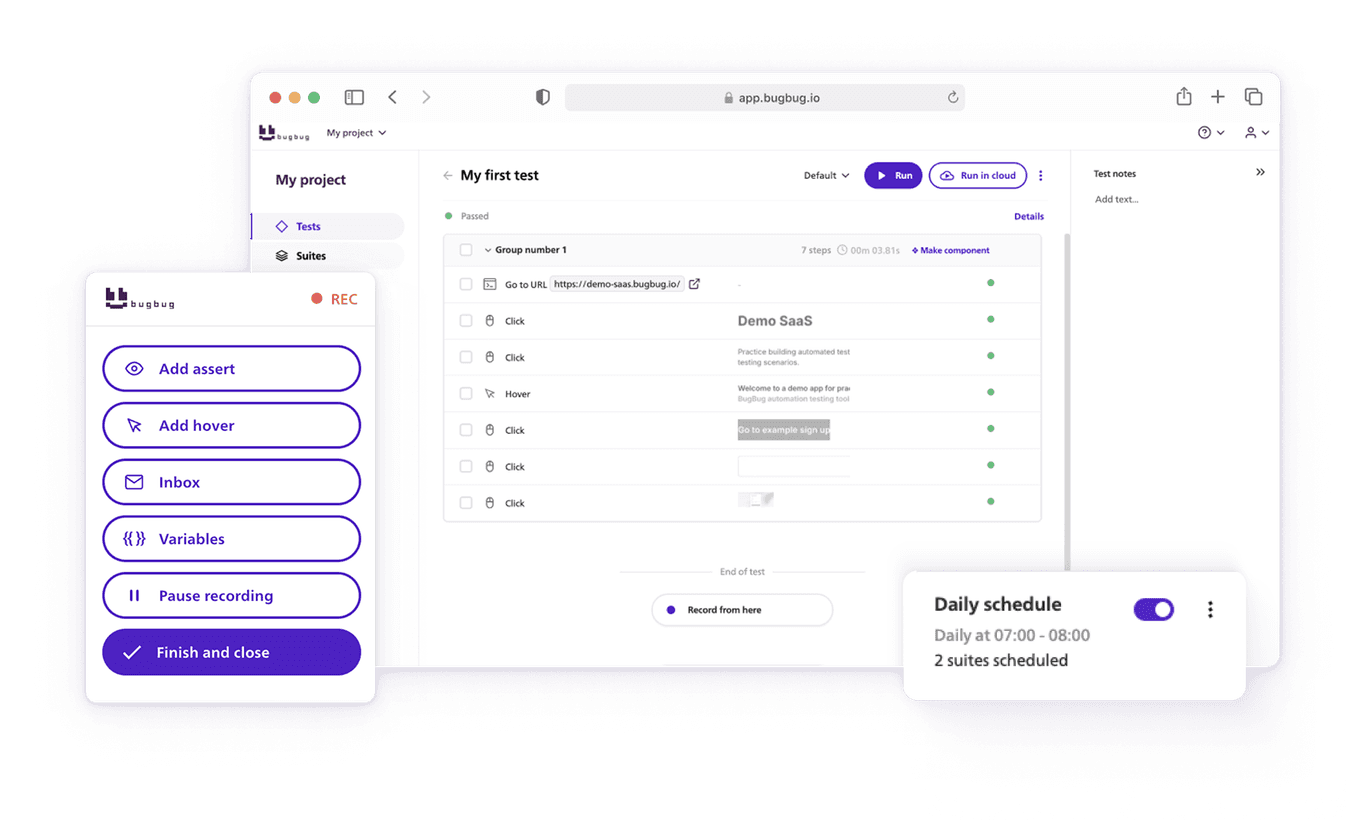
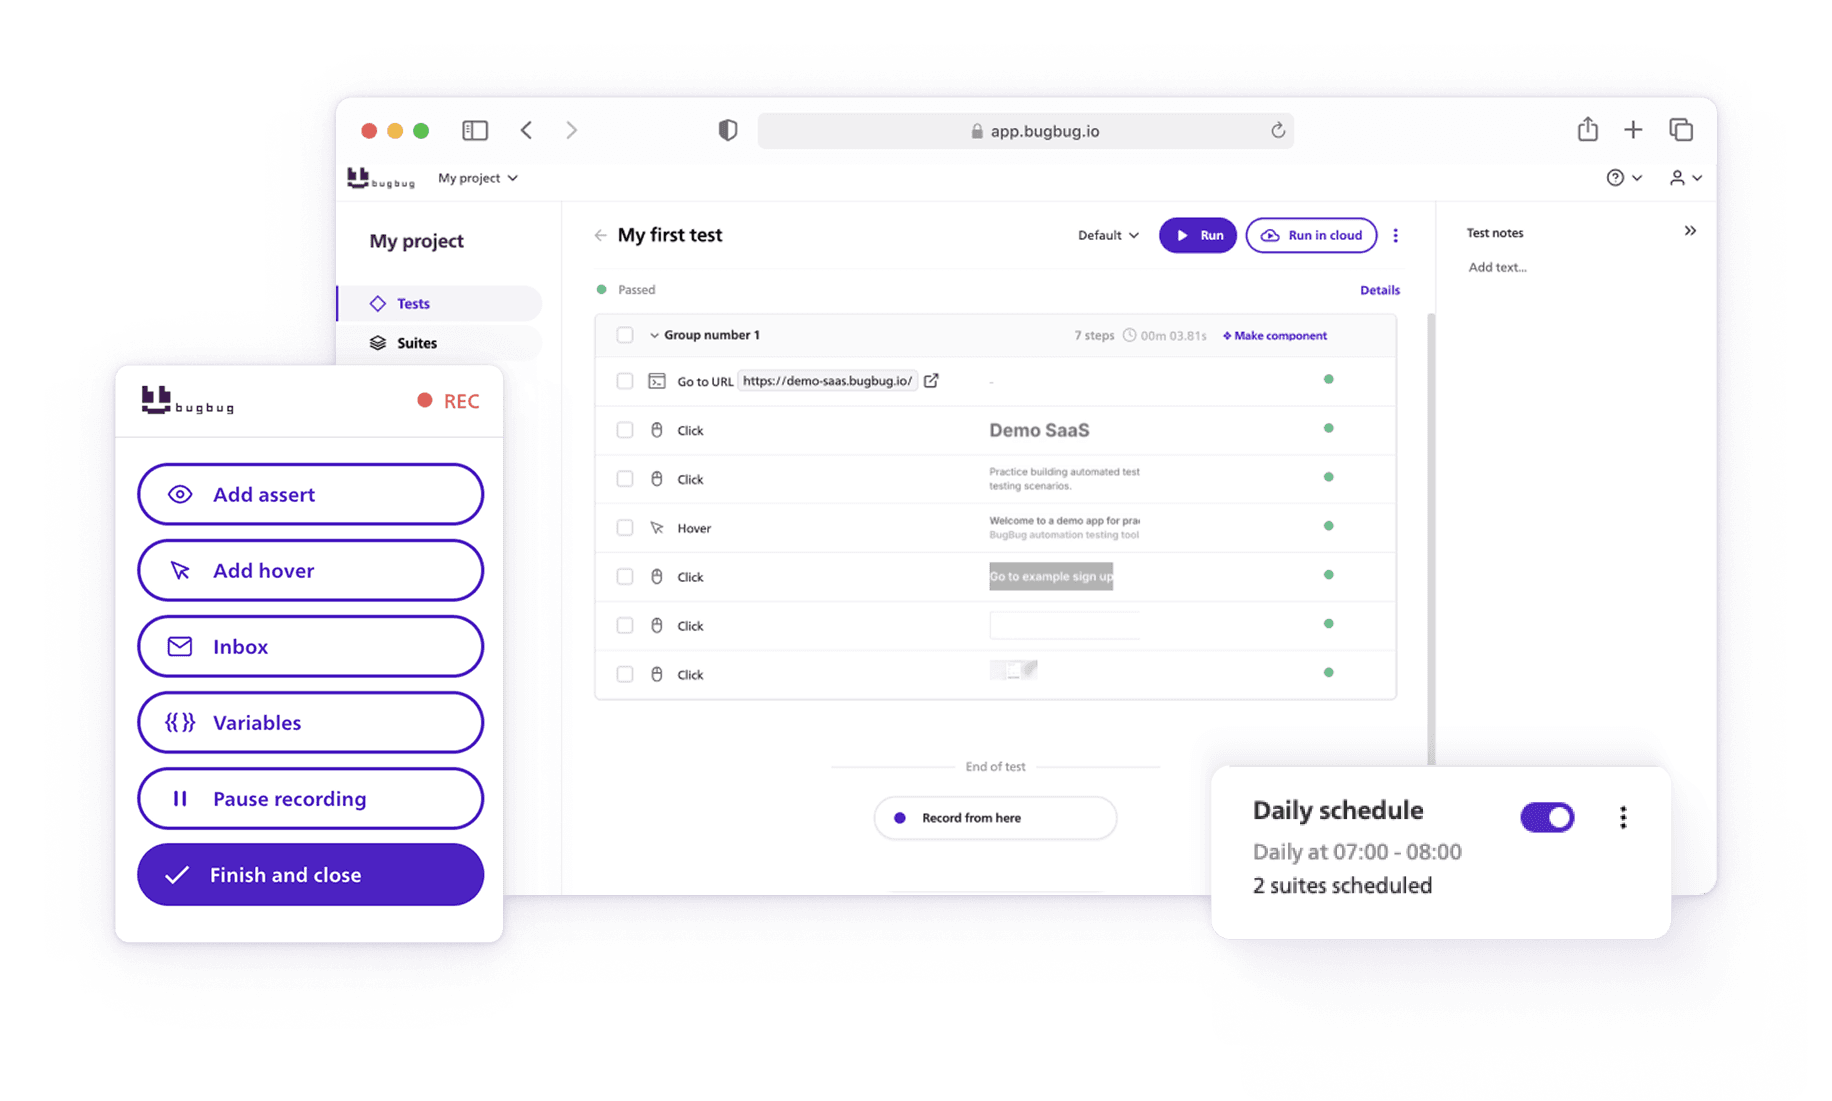
BugBug provides clear and visual test results that support the most important QA metrics, including:
With BugBug, your testing teams can move beyond basic metrics and focus on performance, reliability, and quality at scale.
Agile development has transformed QA metrics from static reporting tools into dynamic instruments for continuous improvement in testing processes. Unlike traditional models that review quality after release, agile emphasizes real-time feedback within short iterations. This demands frequent tracking of key performance indicators (KPIs) to evaluate test execution, detect bottlenecks, and guide decisions during the sprint—not just at the end.
As a result, QA metrics in agile are more actionable, insightful, and essential for team alignment. They help manage resources, identify inefficiencies, and validate whether changes deliver value. Agile has redefined the purpose of metrics—from identifying defects to improving the entire testing and development workflow.
QA metrics aren’t about vanity reporting. They’re about gaining visibility, driving accountability, and delivering better software faster. Whether you're measuring test hour efficiency, defect distribution, or test execution status, the right metrics help QA teams align efforts, manage resources, and continuously improve.
Start simple. Focus on metrics that reveal real insights. Then grow your metrics program as your testing process matures. And remember—with the right tools and mindset, your test results can become your greatest asset.
Automate your tests for free
Test easier than ever with BugBug test recorder. Faster than coding. Free forever.
Get started
To get the most out of your QA efforts and avoid the risks of not testing effectively, consider the following action points:
By following these action points and prioritizing the right QA metrics, your testing process becomes more strategic, efficient, and impactful.
Happy (automated) testing!
Speed up your entire testing process
Automate your web app testing 3x faster.

Dominik Szahidewicz is a technical writer with experience in data science and application consulting. He's skilled in using tools such as Figma, ServiceNow, ERP, Notepad++ and VM Oracle. His skills also include knowledge of English, French and SQL.
Outside of work, he is an active musician and pianist, playing in several bands of different genres, including jazz/hip-hop, neo-soul and organic dub.
Join thousands of QA experts. Subscribe to our newsletter.
Get more testing tips and product related content. Zero spam.
Discover essential accessibility testing tools and software in our guide. Learn how to make your applications accessible for everyone.
Are AI Testing Tools Worth the Hype? The integration of AI into software testing is transforming how we approach quality assurance.
An advanced guide on introducing automated regression testing into your software development process.
1st of our automation testing guides with essential recommendations for startups and saas teams
Learn how to create test automation efficiently, with robust test scripts that are easy to maintain.
Explore the top functional testing tools and frameworks in 2026 in this guide. Choose the best tool to streamline your testing process.
Explore the top manual testing tools. Streamline software testing with the help of our comprehensive guide.
Discover the best Chrome extensions for software testing. Enhance your workflow and customize your browser with the best extensions for Chrome.
Explore the bug life cycle (defect life cycle) in software testing, detailing each defect's journey through stages, and discover important insights.