

As recent data show (https://gs.statcounter.com/browser-market-share), Chrome is the most used browser in the world, with over 64% of population stating that they use Chrome as their go-to browser.
The Chrome Developer Tools (DevTools for short) are a set of web authoring and debugging tools built into Google Chrome. The DevTools provide web developers with improved access to the internals of the browser and their web application. Did you know that they are quite useful for the Testers as well?
Give DevTools a try in testing the web
There are multiple functions in which Dev Tools may support your testing, not only limited to:
- resizing (change user agents)
- screen rotation
- using Console: Debug JS – CSS, Logs
- network manipulation: Throttling, Performance
- security testing
- location change
- looking for elements (id)
- taking screenshots
- clearing cache
- test recording
- database checking (IndexedDB - a transactional database system, like the SQL-based RDBMS)
Automate your tests for free
Test easier than ever with BugBug test recorder. Faster than coding. Free forever.
Get started
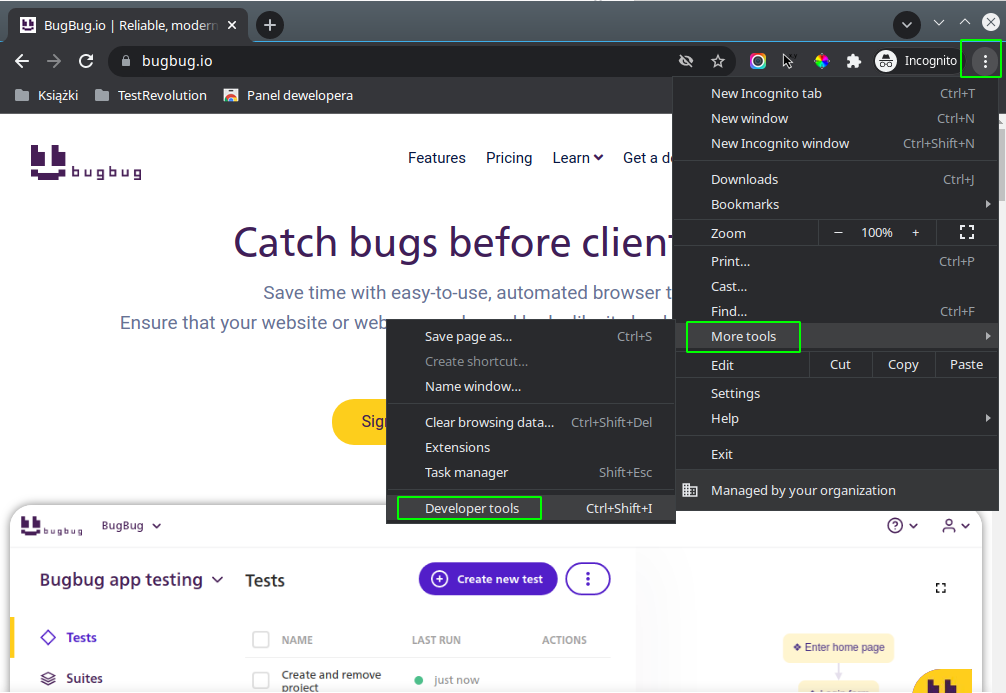
How to open Chrome Developer Tools?
To open the developer console in Google Chrome, open the Chrome Menu in the upper-right-hand corner of the browser window and select More Tools > Developer Tools.
You can also take shortcuts to access developer tools:
On Mac:
Command+Option+I
On Windows/Linux:
F12 or Control+Shift+ I
You can dock your DevTools window to the right of your viewport or at the bottom of the screen, depending on your preferences. By default, DevTools are docked to the right of your viewport. You can also dock to bottom, dock to left, or undock to DevTools to a separate bottom.

It is possible to reorder the panels so they suit your needs best. Click and drag a panel tab to change its ordering. Your custom tab order persists across the DevTools sessions. Fun fact - if you press the ctrl+U combo, you will be able to view the source code of the webpage you are using. It will appear in a new tab so you can see every element on the page and the HTML syntax.
Automate your tests for free
Test easier than ever with BugBug test recorder. Faster than coding. Free forever.
Get started
How to start with Chrome DevTools?
Chrome DevTools can be used in web and mobile testing. Every Tester should take advantage of it because these tools are free and easily accessible. Here is a list of the most useful ideas for testing purposes. Maybe you'll come up with new ones?
Resizing and Rotating
It is important to check the UI of your website on mobile browsers and multiple screen resolutions. For some people, it’s “Just the UI” testing but do remember that nowadays a lion’s share of the market (54.37%) belongs to mobile browsers (stats here).
Moreover with the combination of command+shift+M you'll be able to use the "Toggle device" functionality. It allows you to emulate virtually any mobile device there is plus you can change the device orientation as well.

Use the Responsive option in Google Chrome Developer Tools to make sure that a majority of different screen resolutions is covered.
You can select the desired resolution from the dropdown list of many different mobile devices to test against different screen sizes. DevTools tell us the screen dimensions of the device in the top menu as well.
What is more, you are also able to rotate the screen. Screen rotation is a common cause of mobile bugs, as the mobile website layout changes when the screen is rotated, and page elements may need to reload. While it won't pretend to be the real device, it will give you a lot of hints on what other tests should be performed on your application.

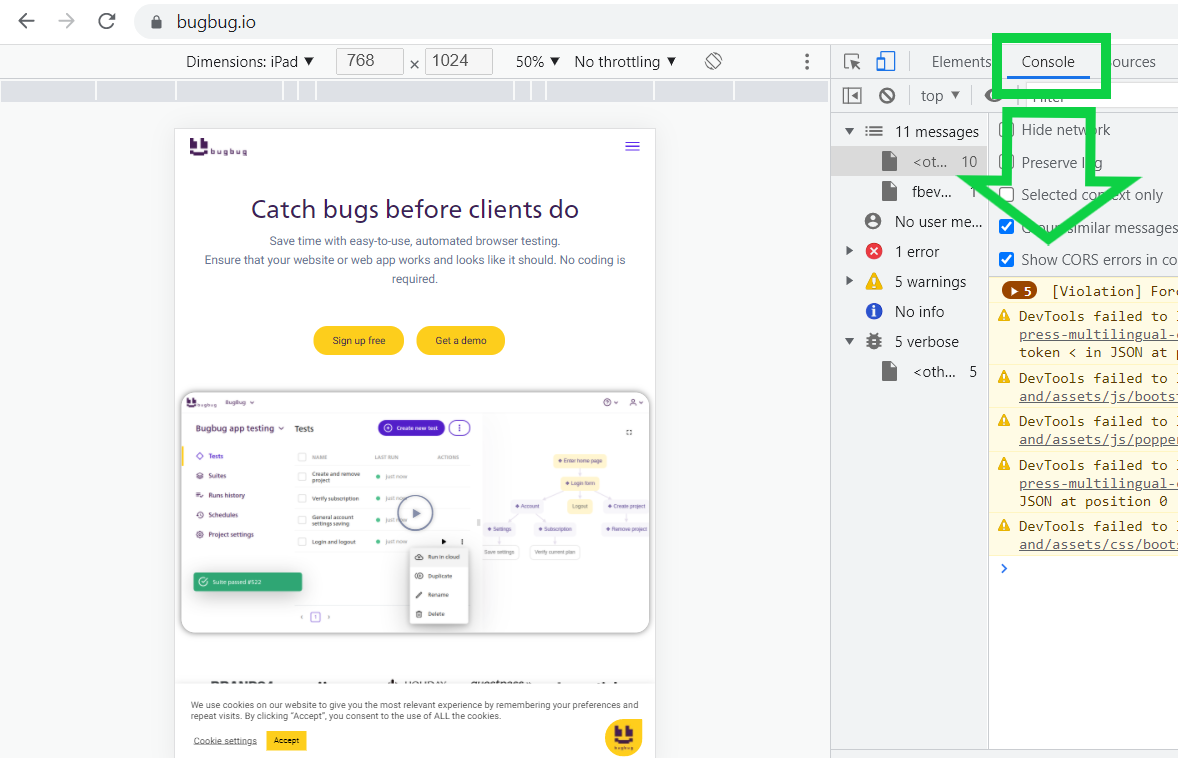
Console - debug
Either a developer or a tester can debug a website on a mobile device.
In the JavaScript Console you can find all ranges of errors in the application. As the complexity of JavaScript applications increases, developers need powerful debugging tools to help quickly discover the cause of an issue and fix it efficiently. The Chrome DevTools include several useful tools to make debugging JavaScript less painful.
Automate your tests for free
Test easier than ever with BugBug test recorder. Faster than coding. Free forever.
Get started
Network and Throttling
The Network option allows you to observe the workflow and load time of all elements. You are provided with insights into resources that are requested and downloaded over the network in real-time. It is of special importance in mobile testing as users expect mobile apps to work smoothly and fast.
- Open DevTools (F12)
- Click the ‘Network’ tab
- Click the No Throttling dropdown
- Select the type of connection you want to imitate
- Reload the page to see the assets downloading at that connection speed.
The Network tab in Chrome DevTools has an option to faux throttle your network, so you can experience what your users might see visiting your website on 3G, Offline, or with your real speed connection. The Throttling option is also useful for visualizing how fonts are loaded. The lower the speed, the more end-user frustration on your website.
In this section, in the left upper corner, there is also a record button that allows you to preserve all the activities (logs) and compare them with other test results.

Elements
The Elements panel allows you to see everything in one DOM tree and fosters inspection and on-the-fly editing of DOM elements. It is also a useful option for automating tests.
You can always access this option for a specific element on the website:
- Mouse-over the element (word, button, etc.)
- Right-click on the mouse
- Click Inspect

In the Chrome DevTools panel, you’ll be directed to the very element in the DOM structure. The Elements tab is extremely useful if you need to play around with CSS in your application. Sometimes you need to switch on and off some buttons/lists/checkboxes. It is possible in this section to select the desired elements in the DOM structure and edit them in the Styles sub-section.
There is also a handy way of locating a node element in the DOM using a CSS selector. From the elements panel, use a keyboard shortcut (win: Ctrl+f, mac: Cmd+f) to open up the search input UI. Enter a CSS selector into the search input UI.
Automate your tests for free
Test easier than ever with BugBug test recorder. Faster than coding. Free forever.
Get started
Clear Site Data
Cache clearing is one of the activities that might be used daily in the testing exercise. Chrome DevTools can successfully help you out.
Press Control+Shift+P or Command+Shift+P (Mac) to open the Command Menu and then run the Clear Site Data command to clear all data related to the page, including Service workers, localStorage, sessionStorage, IndexedDB, Web SQL, Cookies, Cache, and Application Cache.
If you don't want to delete all site data, you can control what data are deleted from Application > Storage.

Location
This is a fantastic functionality! It shows how to test an app that must work in different locations and presents a map for you - teleportation has not been invented yet!
There is an option in DevTools that allows you to mimic location. The option is slightly hidden:
- Open Dev Tools
- Click the action bar in the top right corner of the screen
- Select More Tools
- Click Sensors
Now you can provide a website/application with your desired geo-coordinates and pretend you are there. Remember about reloading the page with every change to the coordinates.

Automate your tests for free
Test easier than ever with BugBug test recorder. Faster than coding. Free forever.
Get started
Performance Monitor
In the same **More Tools **panel you can find the Performance Monitor. Use it to get a real-time view of various aspects of a page's load or runtime performance, including:
- CPU usage.
- JavaScript heap size.
- The total number of DOM nodes, JavaScript event listeners, documents, and frames on the page.
- Layouts and style recalculations per second.
There is also a separated Performance tab in the upper menu, which shows the Compute Intersections in the flame chart. These options can help you to identify the events and debug on its potential performance overheads.

Screenshots
There are two ways of taking screenshots when working with DevTools:
Screenshots of a portion of the viewport
- Click Inspect or press Command+Shift+C (Mac) or Control+Shift+C (Windows, Linux) to enter Inspect Element Mode.
- Hold Command (Mac) or Control (Windows, Linux) and select the portion of the viewport if which you want to take a screenshot.
- Release the mouse. DevTools downloads a screenshot of the selected portion.
Screenshots of specific HTML nodes
- Select an element in the Elements tab
- Open the Command menu
- Start typing node and select Capture node screenshot. DevTools downloads a screenshot of the selected node.
Automate your tests for free
Test easier than ever with BugBug test recorder. Faster than coding. Free forever.
Get started
How to Operate on Mobile Devices?
Last but not least, if you want to test the mobile option, it might be useful to know how to attach your device to Chrome DevTools.
- Install the Chrome browser on your PC
- Get hold of an Android smartphone
- Find a USB cable to connect them
- Plug your device in.
- Type chrome://inspect in the Chrome browser.
On mobile devices, you can take advantage of Chrome Developer Tools in a very similar way to web testing. You can perform throttling, look for elements, or check the network connection. What is more, you are also able to check things in a database through Stetho (debug bridge for Android applications).
If it doesn’t work right away - all you need to do is enable the developer options:
- Open settings
- Go to System> About phone>Version number
- Tap on it 7 times (that’s right)
And there you go.
- Open the developer options
- Switch them on
- Allow USB debugging
From now on the device should be visible in Chrome/inspect.
There is much more to Chrome DevTools - all you need is to explore the options. Each year, Chrome adds new functionalities to its extensions, including DevTools.
The number of options expands and allows not only for better development but also better testing without multiple external tools or applications.
For basic functional testing, Chrome DevTools is more than enough. They just require time to learn how to best use them and to benefit from all the resources they offer.


